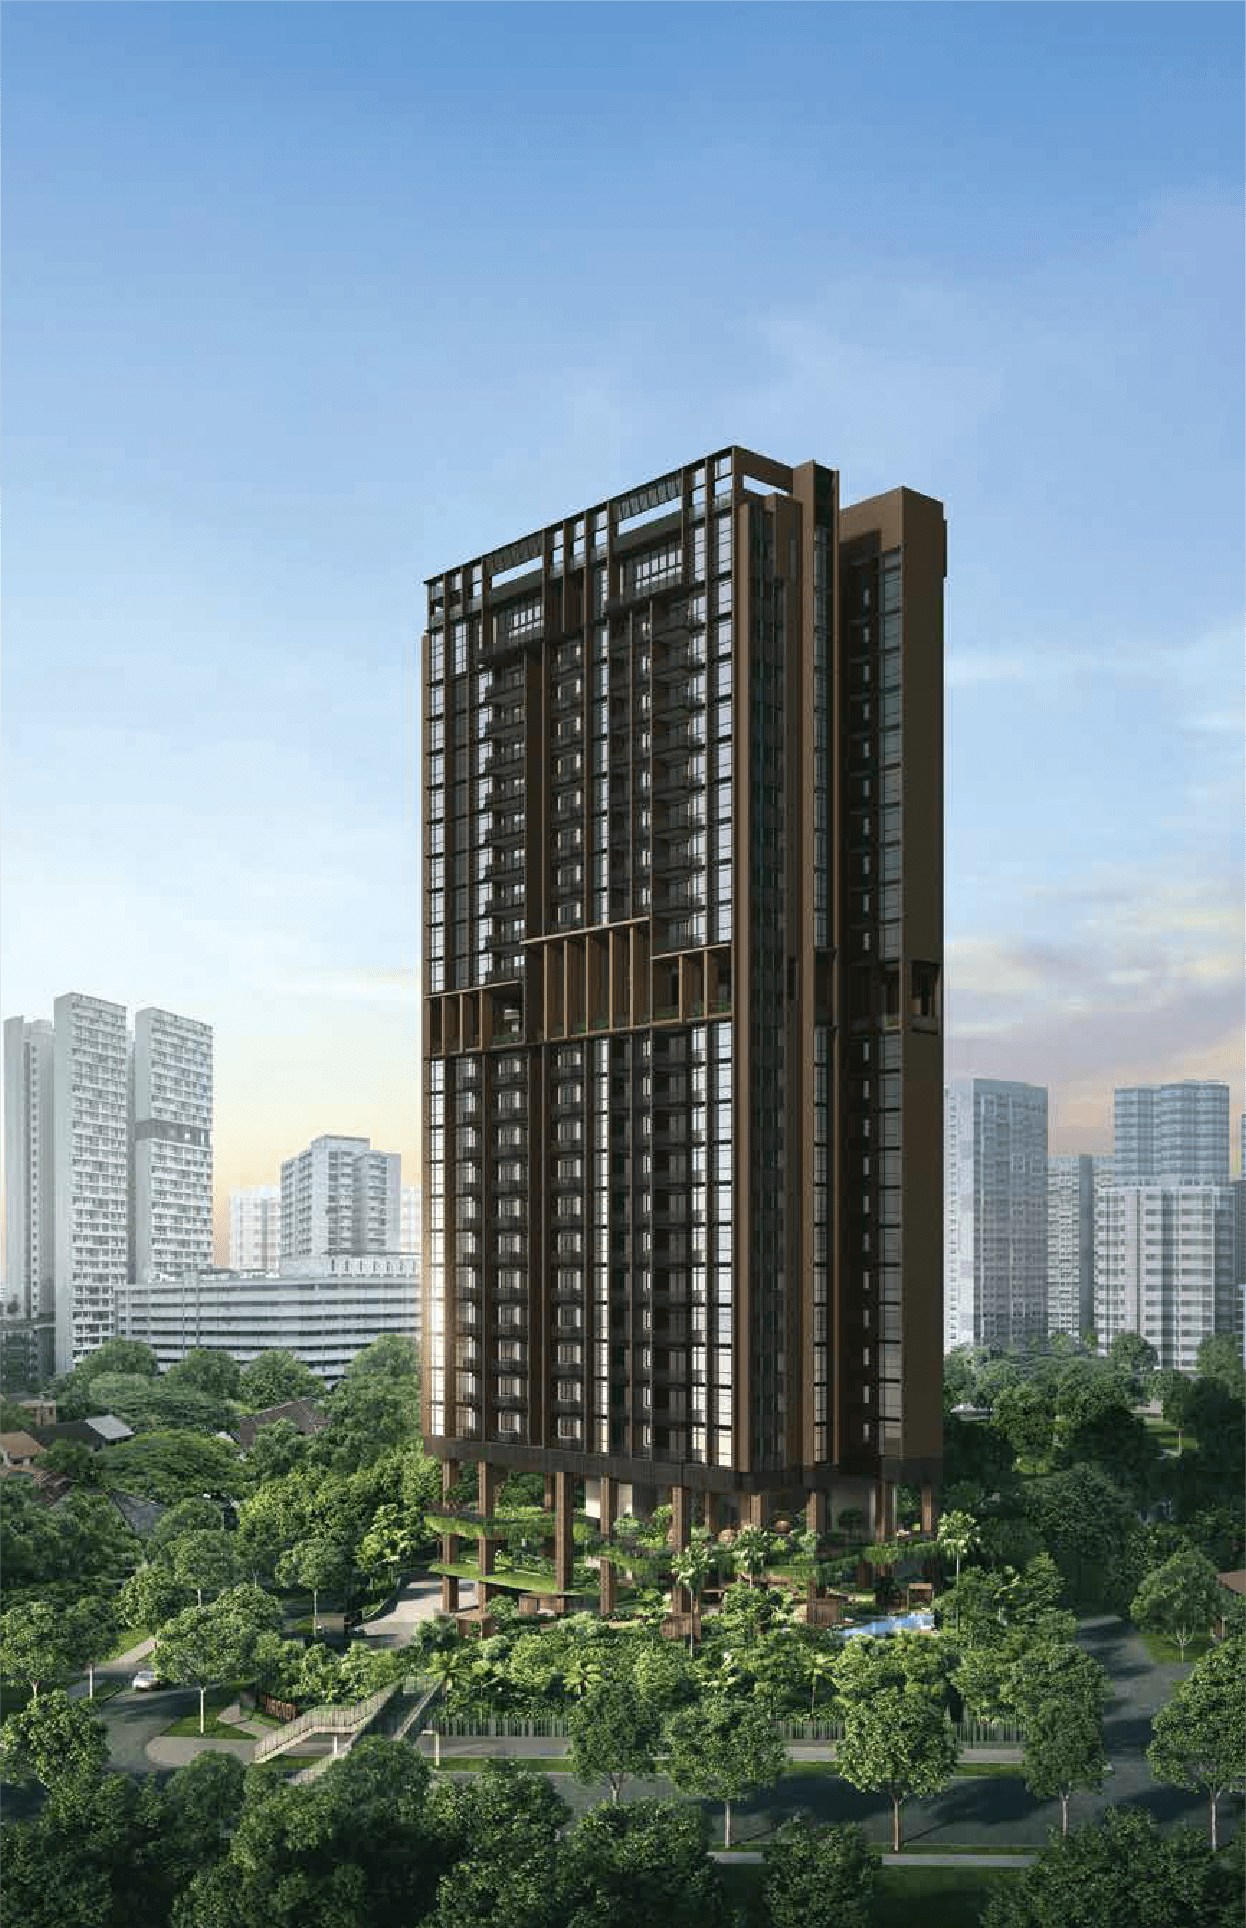
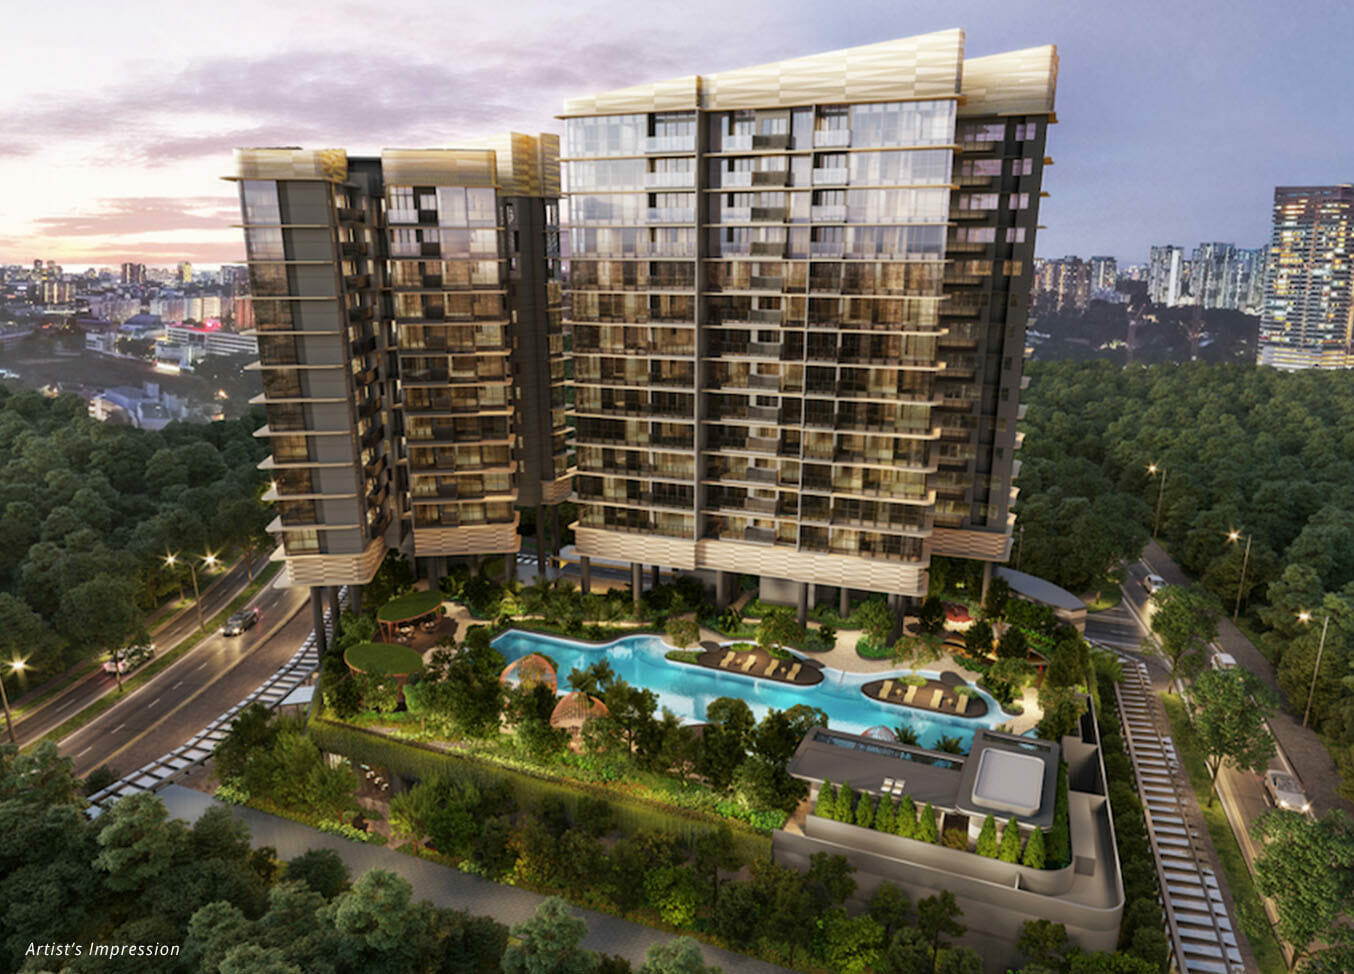
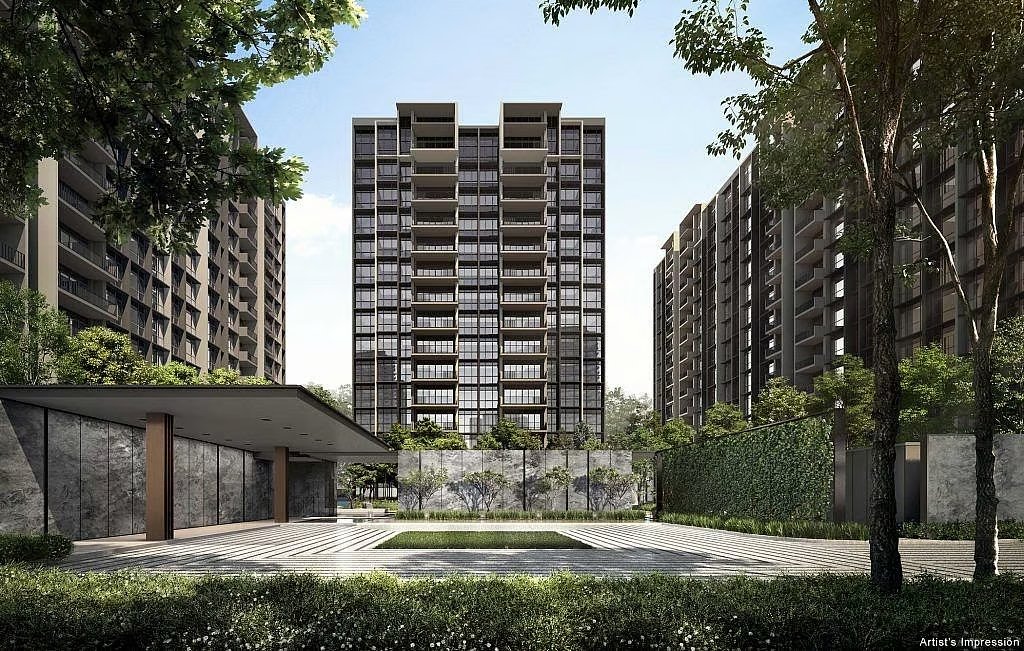
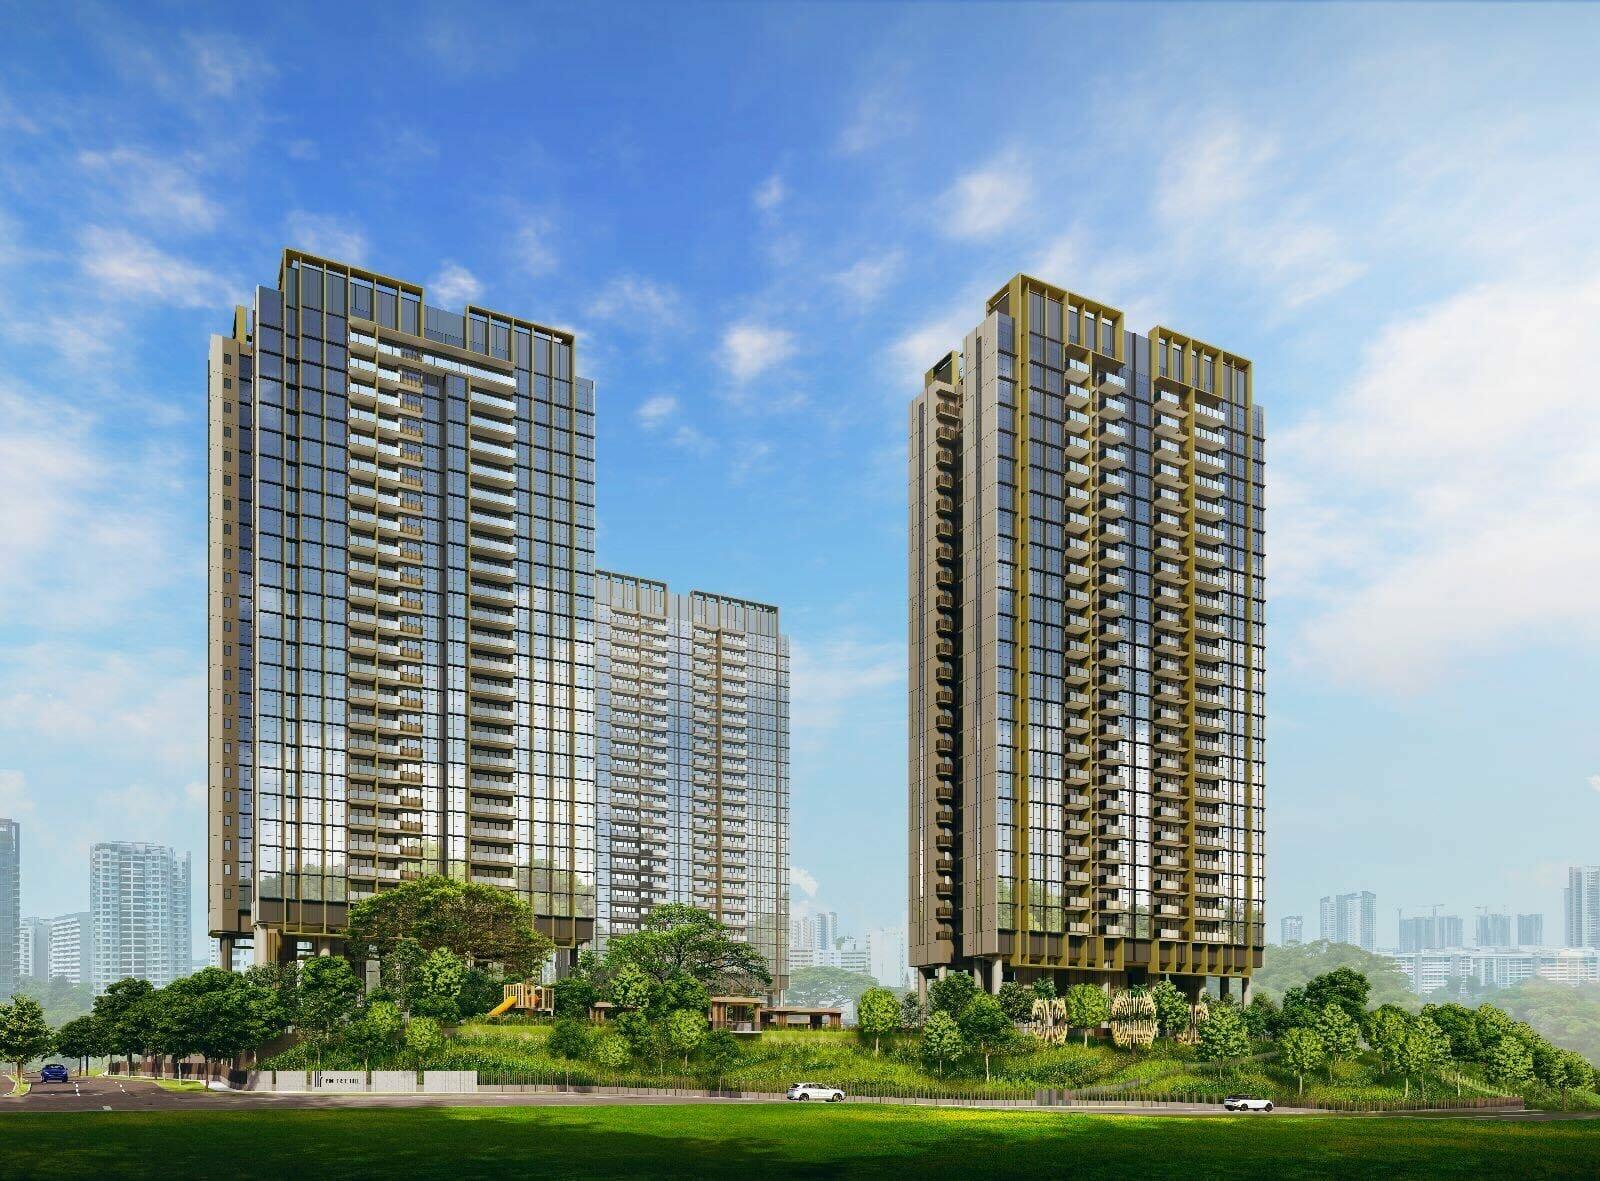
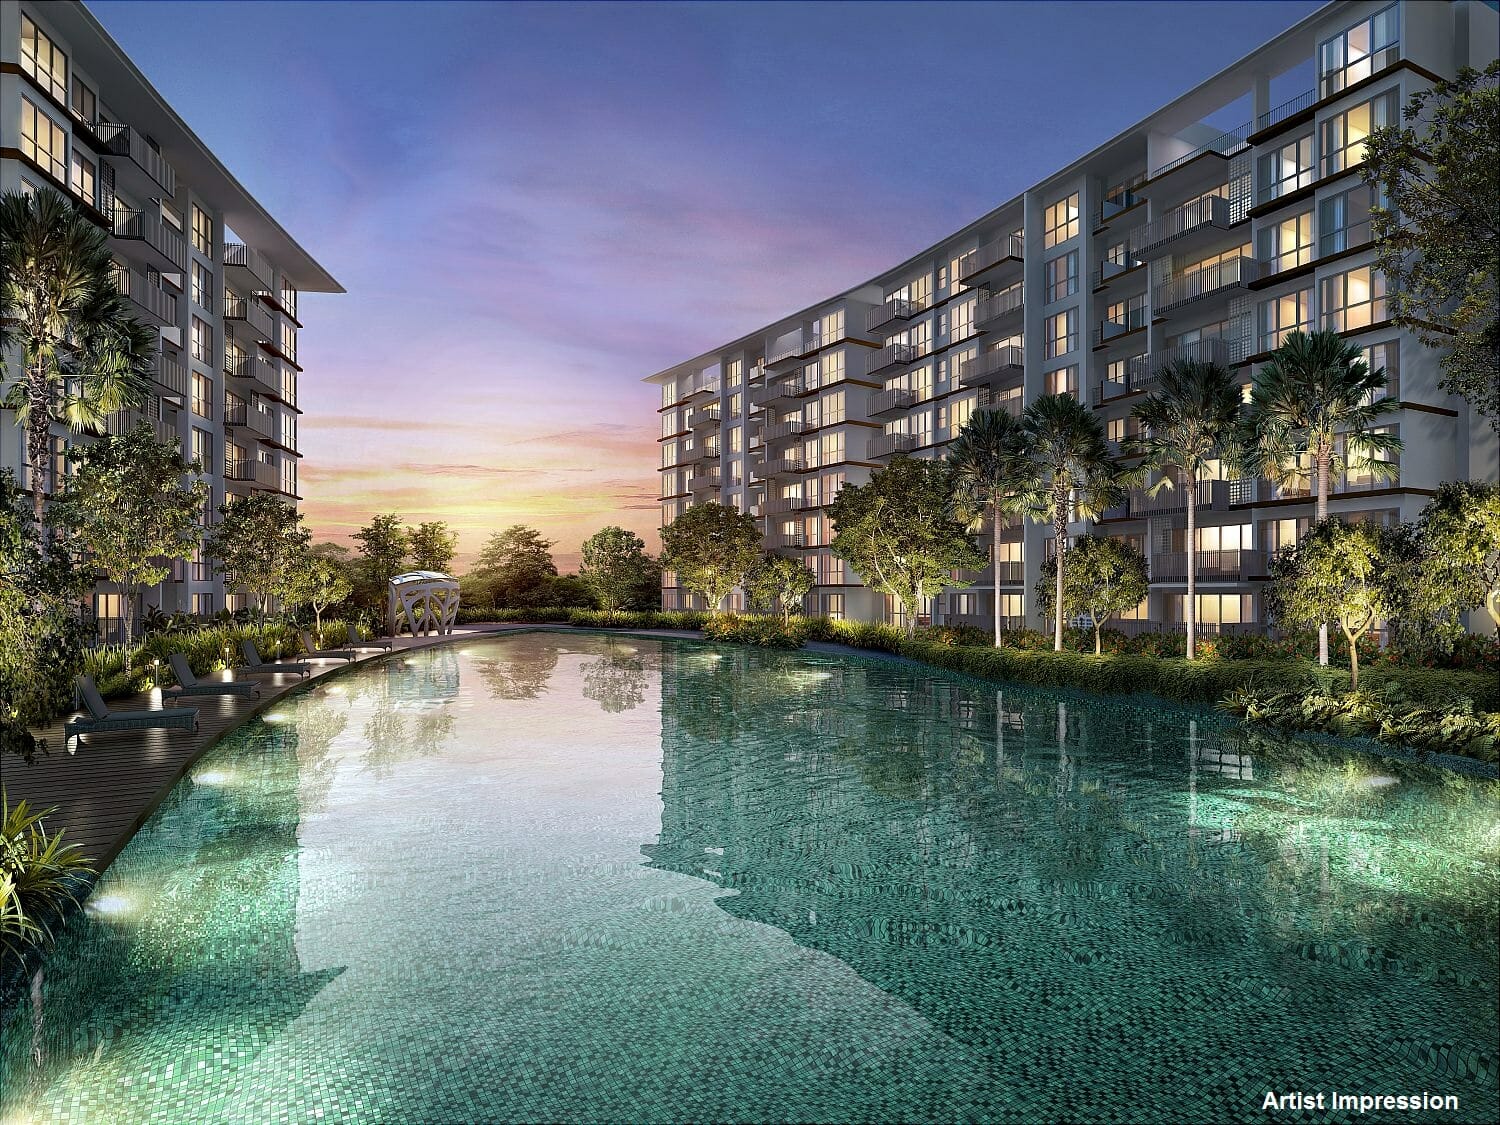
Private condominiums span various districts, each with unique features. Some stand out for their integrated facilities, while others offer prime city access.
These projects present chances for owners who want a new city-fringe residence or a family-friendly location in the suburbs.
Table of Key Private Residential Projects in 2025
| Project Name | Location | Launch Date | Units | Tenure |
|---|---|---|---|---|
| Elta | Clementi Avenue 1 | 7 Feb 2025 | 501 | 99-year |
| Parktown Residence | Tampines Avenue 11 | 7 Feb 2025 | 1,193 | 99-year |
| Arina East Residence | Tanjong Rhu Road | Feb 2025 | 107 | Freehold |
| Aurea | Beach Road | Mar 2025 | 186 | 99-year |
| Lentor Central Residences | Lentor Central | Feb 2025 | 477 | 99-year |
| Zion Road Parcel A | Zion Road | Q2 2025 | 740 | 99-year |
| Zion Road Parcel B | Zion Road | Q4 2025 | 610 | 99-year |
| Marina Gardens Lane | Marina Gardens Lane | Q1 2025 | 790 | 99-year |
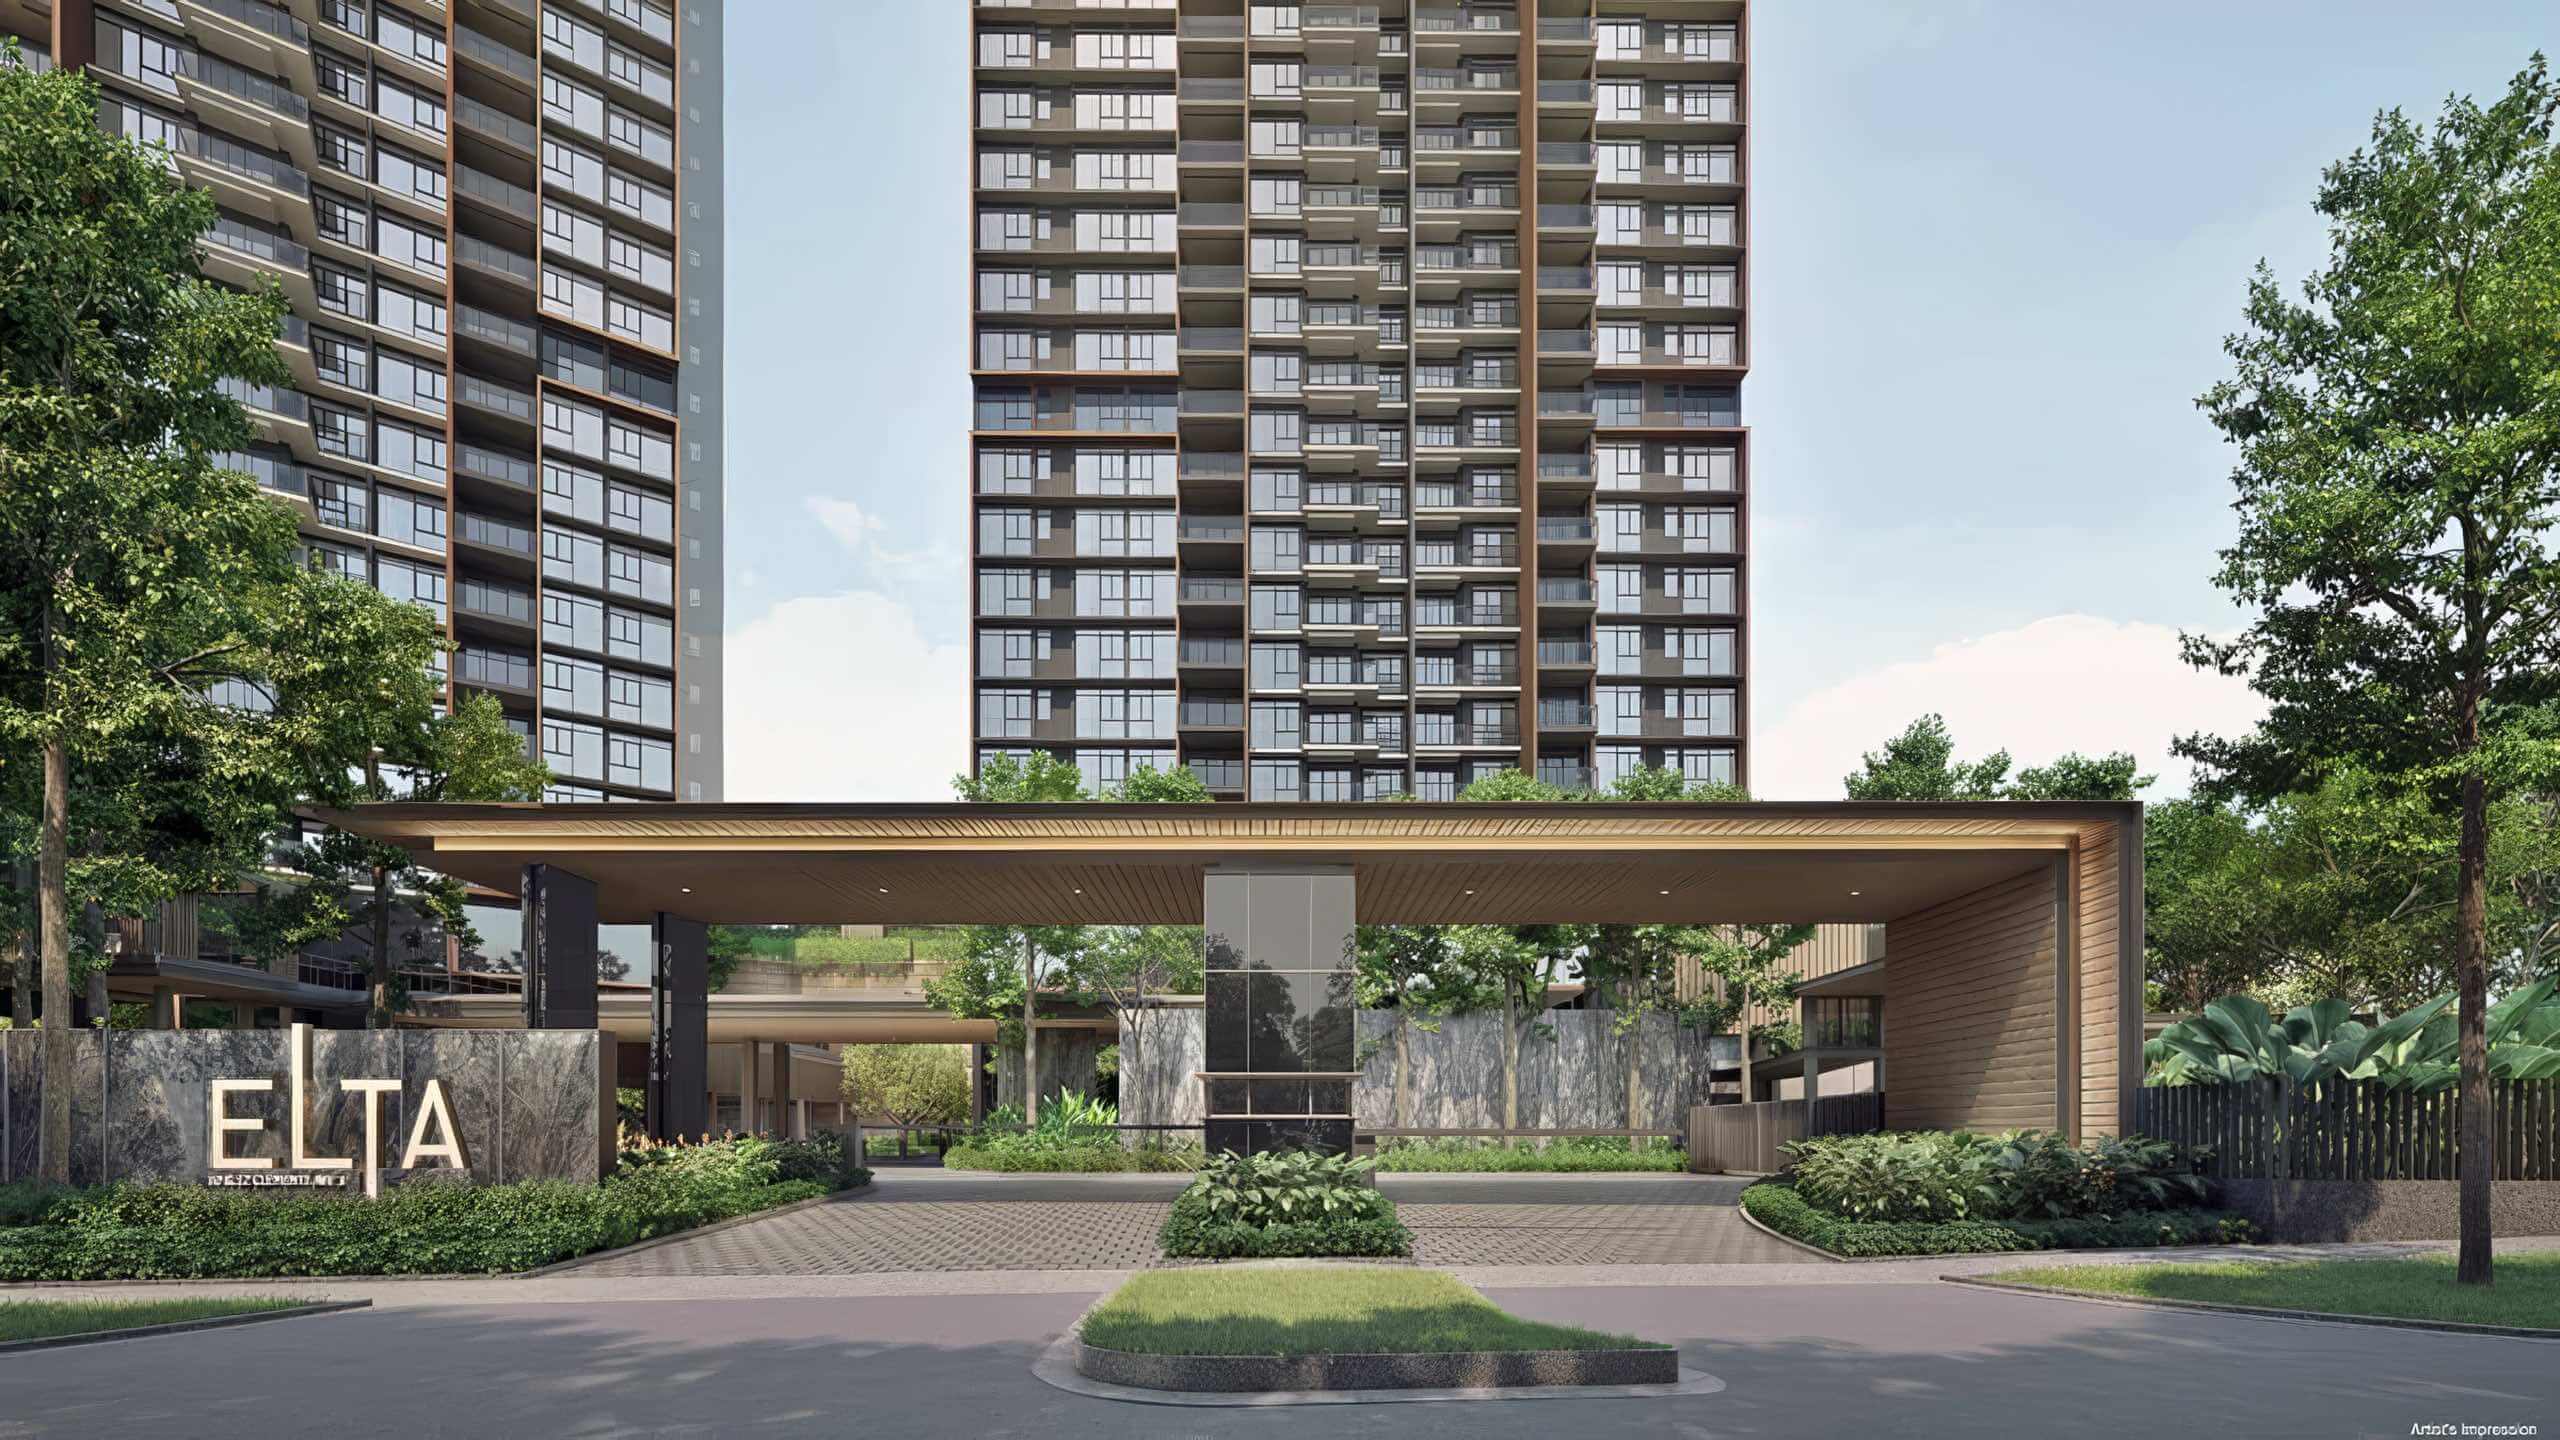
Clementi often draws a mix of investors and owner-occupiers, so I expect Elta to draw similar interest. Families will likely enjoy the recreational options and the well-developed neighborhood.
Tampines remains popular for its malls and transport connectivity. Parktown Residence adds an integrated facility element, including a new bus interchange and a hawker center. I have seen how integrated hubs simplify daily life. Groceries, dining, and transport converge in one spot. Buyers who value convenience may find Parktown Residence appealing.
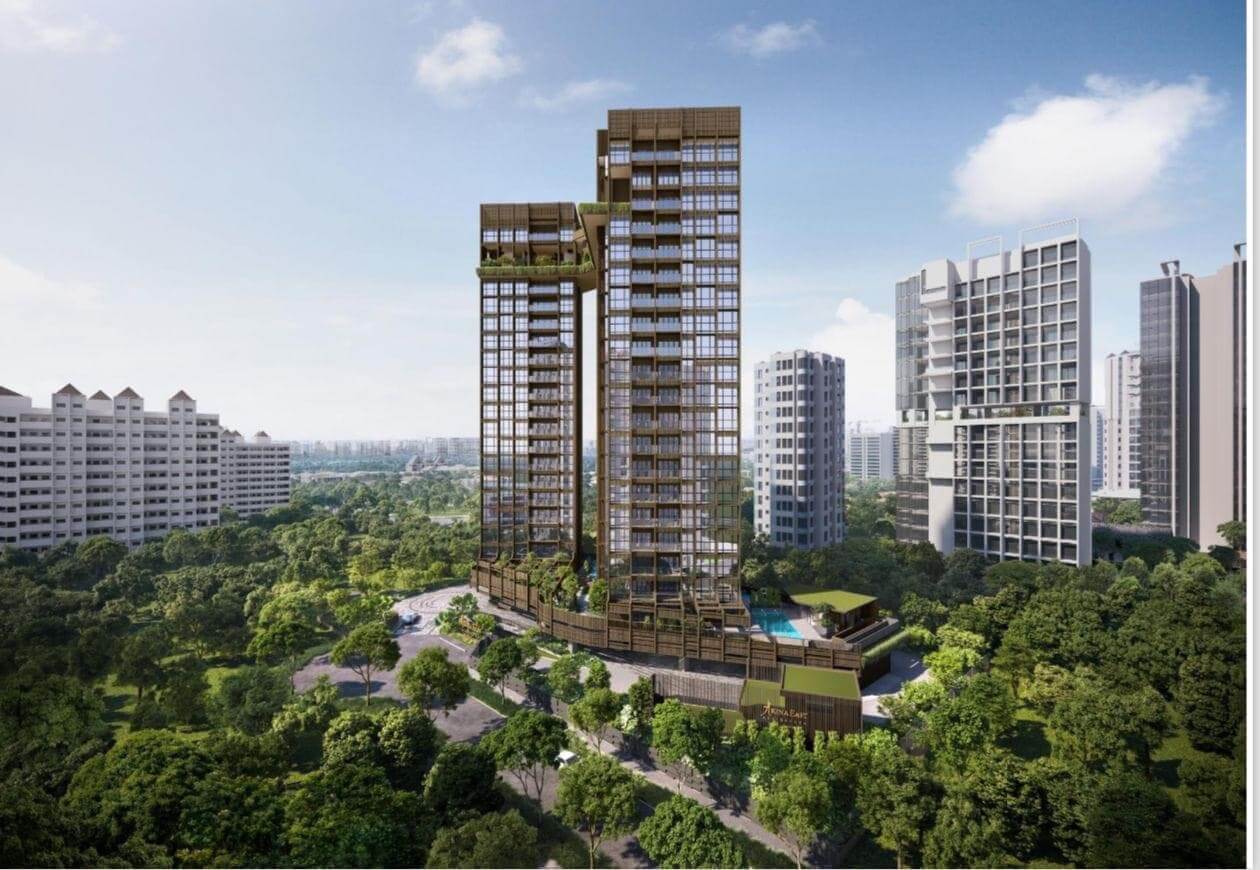
Arina East Residence, with a freehold status, should catch attention from those who want a legacy property. It sits near the Bay area, which offers scenic views. Beach Road’s Aurea may suit buyers who want city living next to future MRT lines and lifestyle attractions. Lentor Central Residences, Zion Road Parcels, and Marina Gardens Lane each offer different perks in city-fringe or downtown locations.
Executive Condominiums (EC)
ECs bridge public and private housing. Prices tend to be lower than standard condos, yet they often include modern facilities. Some of my friends started their homeownership journey with ECs, then upgraded later when finances allowed.
| Project Name | Location | Launch Date | Units | Tenure |
|---|---|---|---|---|
| Aurelle | Tampines Street 62 | 14 Feb 2025 | 700 | 99-year |
| Tengah Plantation Close EC | Plantation Close | Q2 2025 | 495 | 99-year |
| Jalan Loyang Besar EC | Jalan Loyang Besar | Q4 2025 | 710 | 99-year |
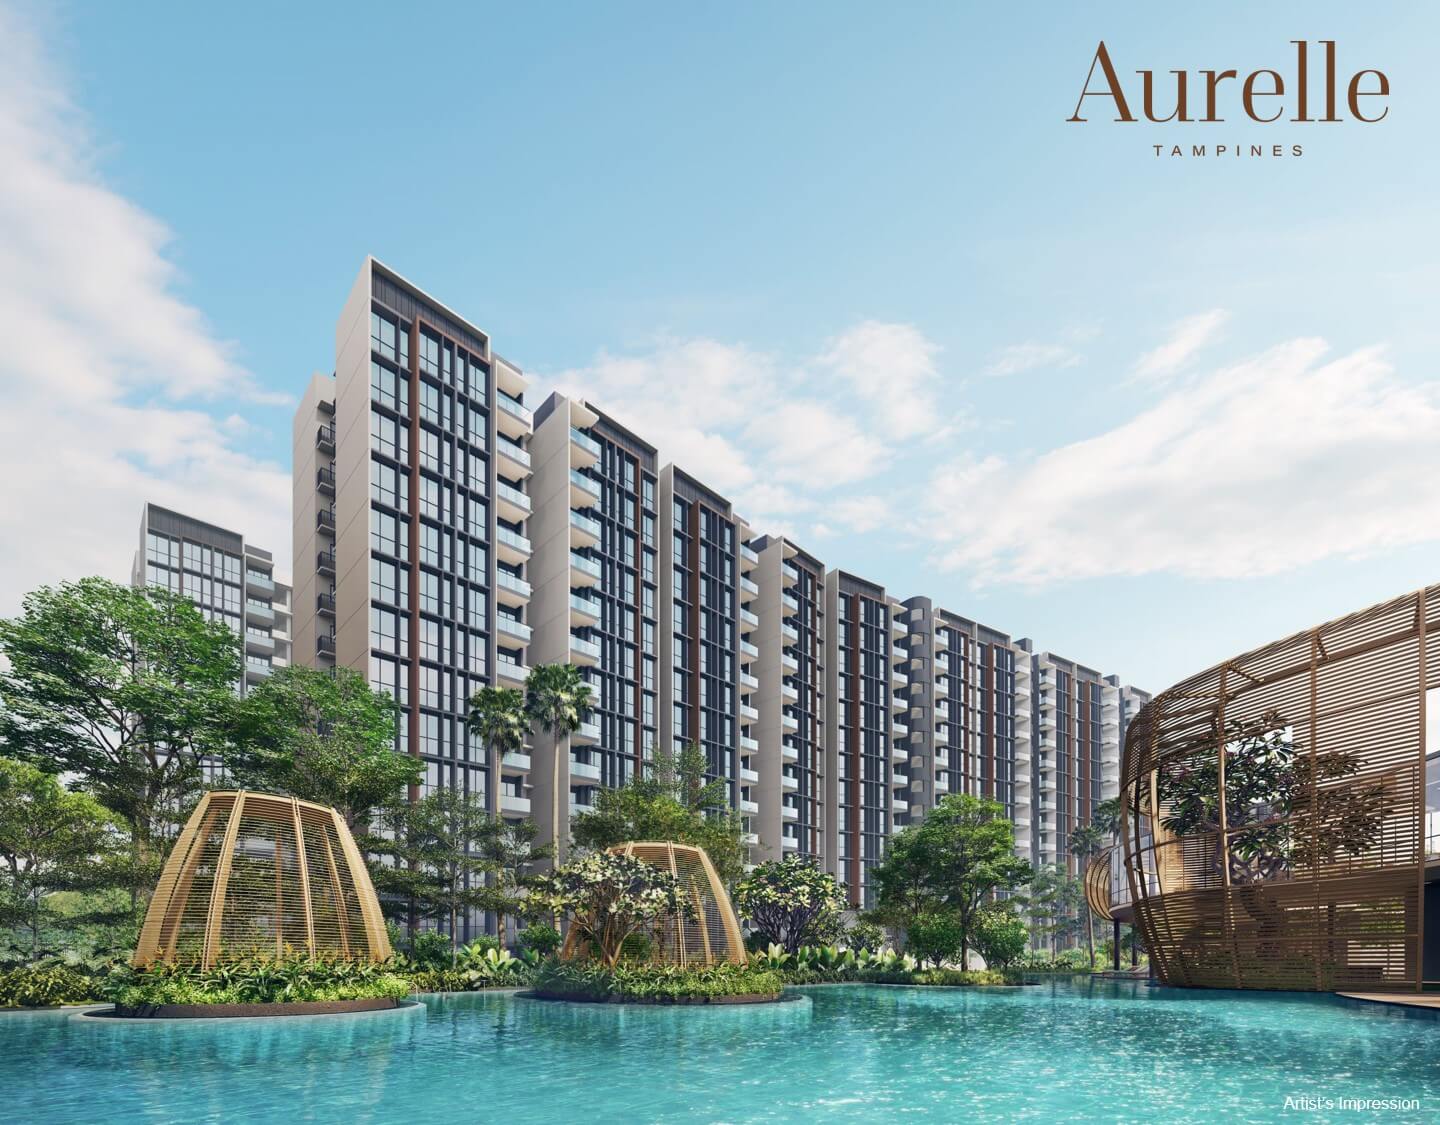
Aurelle stands near the upcoming Tampines North MRT, which helps with transport and daily travel. Tengah Plantation Close EC taps into the “Forest Town” appeal, with lots of greenery. Jalan Loyang Besar EC gives quick access to the east coast. People who prefer recreational spots like Pasir Ris Park may find this location tempting.
Price Trends and Market Data
Homebuyers often analyze price per square foot (psf) to compare different regions. Below is a quick chart of estimated psf rates for upcoming units:
| Parameter | Data |
|---|---|
| Outside Central Region (OCR) | ~$2,200 psf |
| Rest of Central Region (RCR) | ~$2,700 psf |
| Core Central Region (CCR) | ~$3,200 psf |
| Executive Condominiums (EC) | ~$1,700 psf |
| Average Rental Yield (Overall) | Around 3.2% |
| Prime District Rental Yield Range | About 2.5% to 3.5% |
| Recent Rental Market Change | Rents dropped by about 4% in recent data |
These figures guide buyers or investors who want a quick view of 2025 price points and yield considerations. Prices in prime districts usually run higher, which can narrow rental yield margins. Rental trends can shift, so monitor market updates for a clearer outlook.
Regional Price Changes (2014-2024)
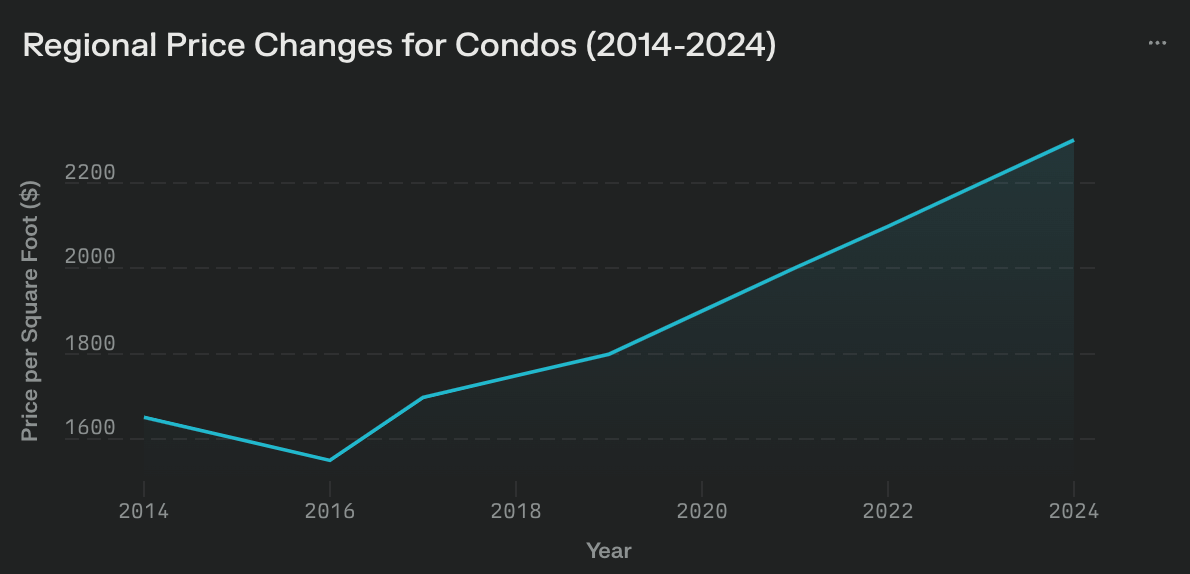
The chart illustrates the regional price changes for condos in Singapore from 2014 to 2024, showing a clear trend of price fluctuations followed by steady growth in recent years. Below is an analysis based on the data:
Key Observations
- Initial Decline (2014-2016):
- Condo prices per square foot (psf) decreased from $1,650 in 2014 to $1,550 in 2016, reflecting a downturn during this period.
- Recovery and Growth (2017-2024):
- Prices rebounded in 2017, reaching $1,700 psf, and continued to grow steadily each year.
- By 2024, the price reached $2,300 psf, marking a significant increase of approximately 39.4% over the decade.
- Acceleration Post-2020:
- The growth rate became more pronounced from 2020 onwards, likely driven by increased demand and limited housing supply.
Factors Influencing Price Trends
- Market Cooling Measures:
- The decline between 2014 and 2016 may be attributed to government cooling measures aimed at stabilizing property prices.
- Post-Pandemic Recovery:
- From 2020 onwards, the market saw higher demand for private properties as Singapore recovered from COVID-19 disruptions.
- Increased Land Costs:
- Rising land prices contributed to higher costs for new launches, pushing up overall property prices.
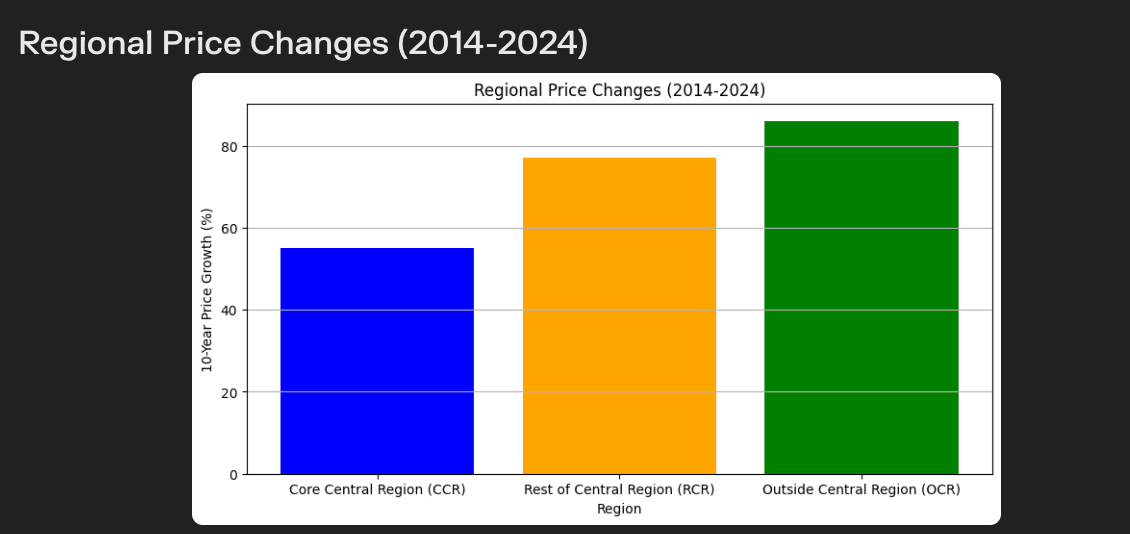
The bar chart illustrates the 10-year price appreciation across different regions:
- Outside Central Region (OCR) showed highest growth at 86%
- Rest of Central Region (RCR) achieved 77% growth
- Core Central Region (CCR) experienced 55% growth
- Clear indication that suburban areas outperformed prime districts
Unit Size Trends (2010-2024)
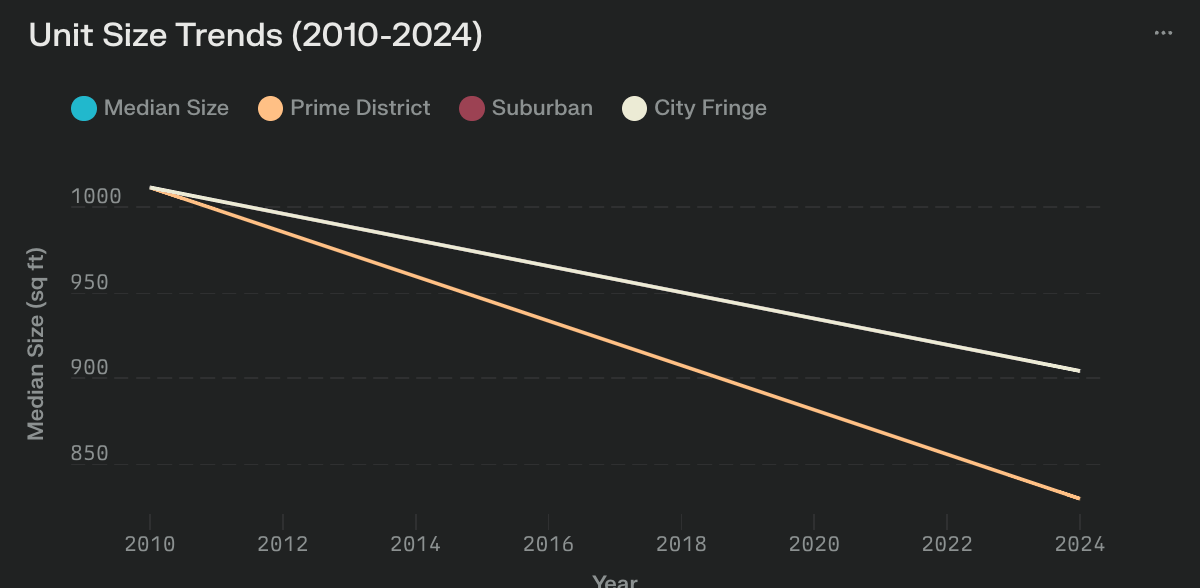
The line graph demonstrates the evolution of unit sizes:
- All regions started at approximately 1,012 sq ft in 2010
- Prime District units saw the steepest decline to 829 sq ft (-20.6%)
- Suburban and City Fringe areas maintained larger sizes at 904 sq ft
- Overall median size decreased by 10.6%
New Condo Rental Price Changes (2014-2024)
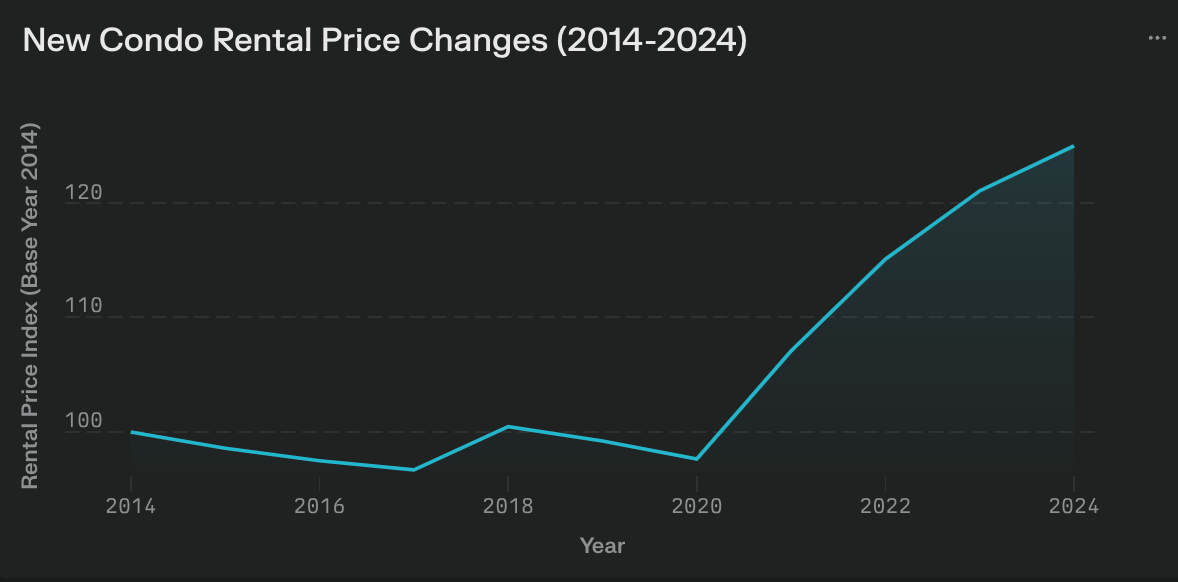
The chart illustrates the rental price index for new condominiums in Singapore from 2014 to 2024, with 2014 as the base year (index = 100).
Key Insights:
- 2014-2016: Decline in Rental Prices
- Rental prices decreased steadily from 2014 (index = 100) to 2016 (index = 96.57).
- This decline was due to oversupply in the market and subdued demand.
- 2017-2020: Stabilization and Minor Fluctuations
- The rental index saw minimal changes, hovering around 97-100.
- Market recovery was slow during this period, with slight dips in 2019 and 2020.
- 2021-2024: Strong Growth
- A sharp increase in rental prices began in 2021, reaching an index of 107.06.
- This trend continued through 2022 (115.06), 2023 (121.06), and peaked at 125.06 in 2024.
- Factors contributing to this surge:
- Post-pandemic recovery driving demand for rental units.
- Limited housing supply due to construction delays.
- Increased demand from expatriates and local tenants.
Projects With Strong Rental Yield
Rental yield attracts investors. Below is a table of projects with higher yields:
| Project | Rental Yield | Location | Notes |
|---|---|---|---|
| The Hillford | 6.1% | District 21 | Near Beauty World amenities, 60-year lease, smaller unit sizes |
| Kovan Grandeur | 6.0% | District 19 | 99-year leasehold, completed in 2011, supported by active neighborhood |
| Le Regal | 5.5% | District 14 | Freehold status, smaller units, good connection to city center |
| #1 Suites | 5.5% | District 14 | Freehold status, smaller units, easy transport access |
Most private condos average around 3.2% yield. Prime areas tend to hover between 2.5% and 3.5%. Higher yields often come from lower entry prices or smaller units. However, I have observed that smaller units may require more careful planning for future resale. A plus is the rental demand, but you should confirm that the lease type or development restrictions align with your goals.
Market Context
- Rental rates dipped by 4% in recent quarters, which could affect short-term gains.
- Government measures may temper speculative moves, with taxes or restrictions that dampen free-wheeling investments.
- Properties in central areas often have higher prices, which narrows the rental yield gap.
Projects Expected To Command Higher Prices
Certain developments sit in prestigious districts or next to iconic landmarks. These projects usually list higher psf values. They target those who see value in prime addresses or signature city views.
Core Central Region (CCR)
- Marina View Projects
- Includes W Residences Singapore with 683 units.
- Luxury layout plus a hotel element.
- Prices may exceed $3,200 psf.
- Located near Marina Bay Sands and central business zones.
- Aurea (Former Golden Mile Complex)
- Beach Road, 186 units, launch in March 2025.
- Likely around $2,900 psf.
- Potentially appealing for those who want a city address near the new developments along Beach Road.
- Zion Road Developments
- Parcel A: 740 units, Parcel B: 610 units.
- Estimated above $3,000 psf.
- Well-known for easy access to the Orchard shopping belt and the Singapore River.
Rest of Central Region (RCR)
- The Orie (Toa Payoh Lorong 1)
- 777 units, near Braddell MRT.
- Possibly around $2,800 psf.
- First new launch in Toa Payoh in 10 years, close to popular schools.
Reflections and Tips for 2025
Many buyers through the process of choosing between a suburb or a central option. Suburban homes offer a quieter environment, often with bigger unit types at lower psf.
Central homes fit those who want city amenities. Both options should see price growth in 2025 due to limited supply of about 5,348 private units. This supply crunch may push prices higher.
Planning Your Purchase
- Check Total Budget: Factor in down payment, monthly loan, and potential renovation.
- Compare Rental Potential: If renting out, look at current yields, local amenities, and tenant profiles.
- Evaluate Layout: Some smaller units cost less but can be tight for families.
- Keep an Eye on Policy: Changes in stamp duties or taxes can shift overall costs.
Conclusion
Singapore’s condo market in 2025 looks vibrant. New integrated developments, prime city projects, and ECs each meet different needs. Prices may edge upward, but unique niches will give varied options. My own experience shows that early preparation helps buyers make calm decisions.
Study location details, weigh up financing, and pick a home that fits your lifestyle. Each project brings distinct advantages that may suit your goals, whether for living or investing.
